Does this tell me what to trade?
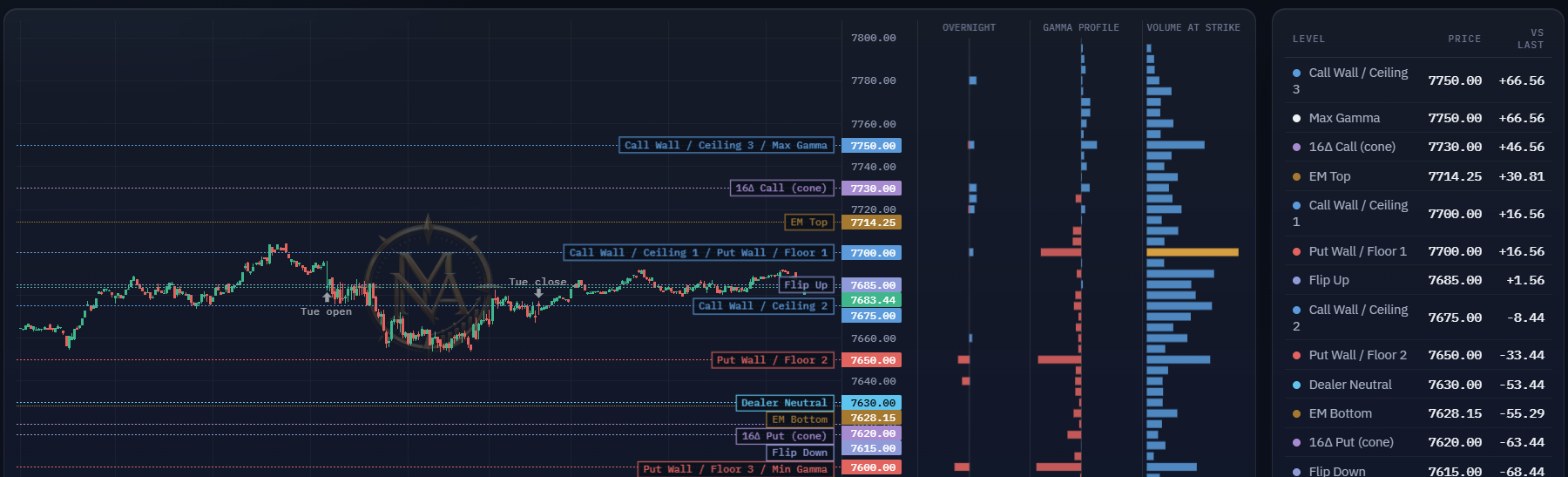
No. Levels is market-structure analytics only — it shows where gamma and expected-move boundaries sit for the session and how the session played against them. It does not issue entries, exits, targets, stops, or buy/sell recommendations, and it is not a signal service. What you do with it is entirely your own decision.
What is the Modeled Session?
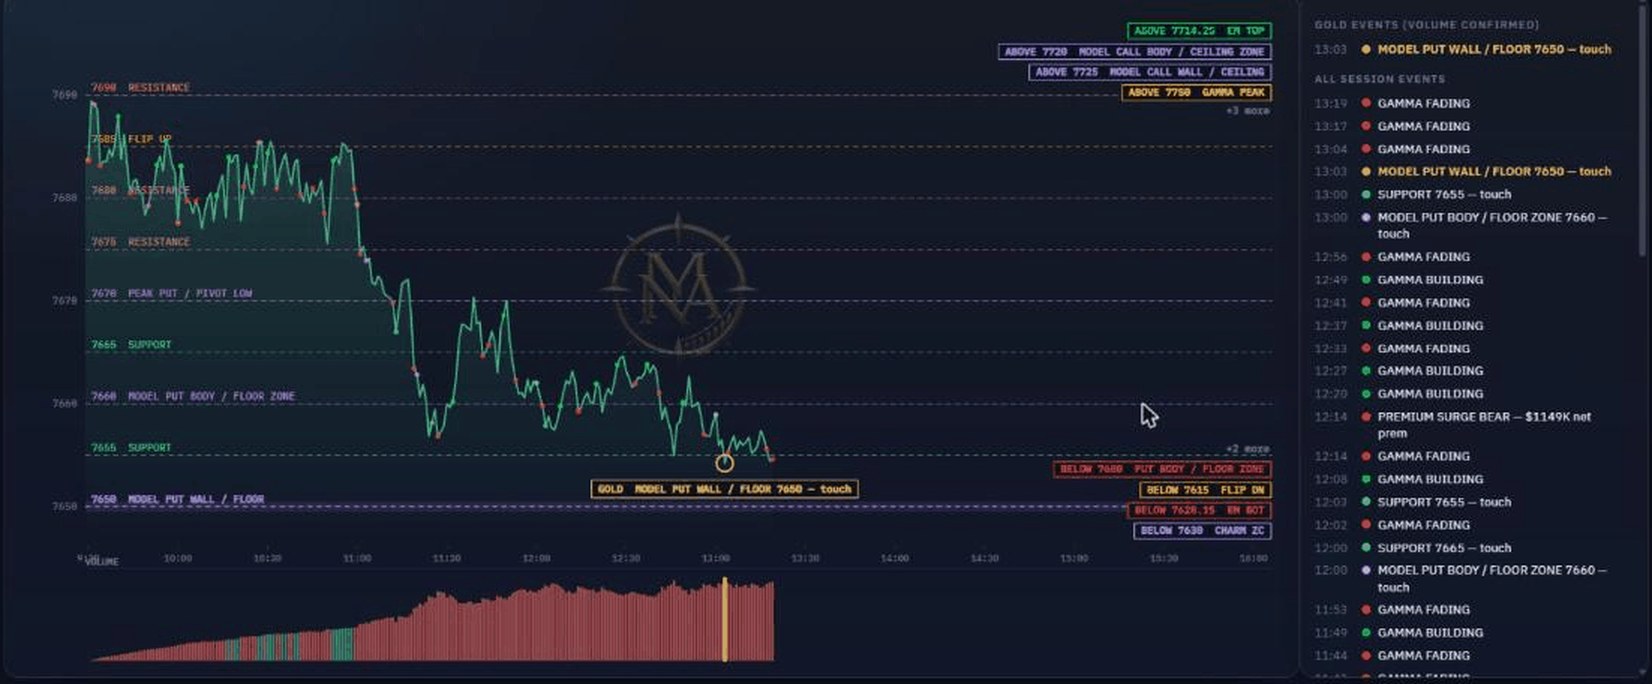
Our quantified, research-driven models place levels for the session — put walls and floors, call walls and ceilings, and their zones — then mark the events as price meets them: touches, gamma building or fading, charm shifts, flow surges, and the volume-confirmed “gold” moments. You get a scorecard and a replay you can play or scrub. We use AI to help quantify parts of our models and research. Its output is an estimate and can be wrong — see the disclaimer under the footage.
Are SPX and SPY one subscription?
The Levels Chart + GBS plan is one subscription that covers both SPX and SPY. The Modeled Session is SPX for now, with SPY to follow. The bundle includes both.
How current is the data?
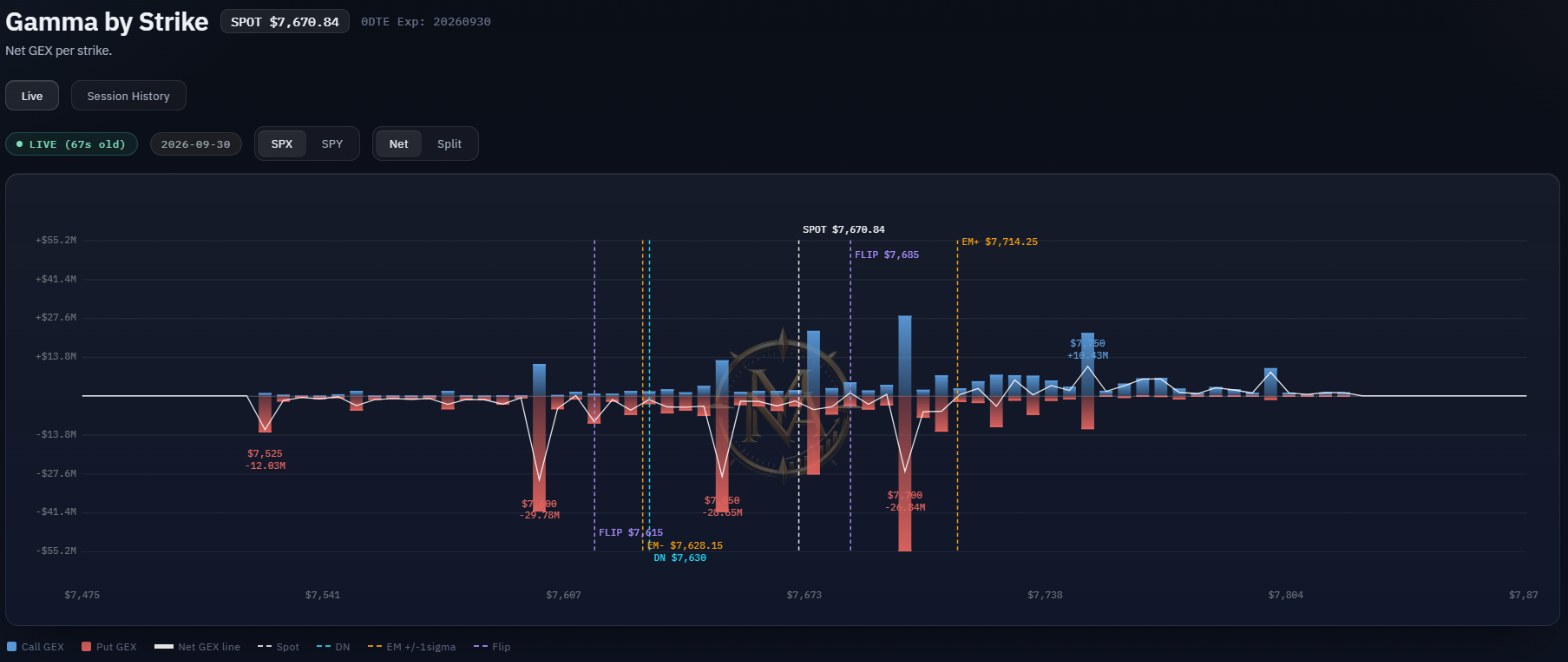
GBS and the levels chart are computed from OPRA options data obtained through a licensed commercial market-data vendor and refresh about every 60 seconds during the session. The Modeled Session updates through the day; outside market hours you see the most recent session.
Can I see previous sessions?
The Modeled Session plan shows the current session with a full replay of it. The Levels Chart and the GBS dashboard are live views, without a replay. Access to earlier sessions is not part of the plans at this time.
Can I change or cancel my plan?
You can cancel any time from your account page, which opens the Stripe billing portal; cancelling stops the next renewal. You can also switch between plans there; changes are prorated.